
The Art and Science of Phospho Flow: Capturing Cell Signals with Cytometry
Intracellular signaling cytometry uses antibodies that bind to specific epitopes on signaling proteins, usually to activated forms of the protein, to analyze signaling dynamics at a single-cell resolution. These data can be valuable for many kinds of studies, from basic research to clinical trials, but pose additional challenges compared to immunophenotyping. In this post, we discuss some common considerations when designing an experiment with signaling markers in the panel.
Why Measure Cell Signaling?
Whereas immunophenotyping indicates the type of a cell, signaling events reveal the functional behavior of a cell at a specific moment. Since functional dysregulation drives many diseases, such as proliferation in cancer and inflammation in autoimmune disease, cell signaling is an important target for drug development. Consequently, assays that provide information about cell signaling are useful as diagnostics, clinical biomarkers, and basic research tools.
Because signaling is highly dynamic, with cells responding seconds to minutes after sensing an environmental change, signaling assays are well suited to measure the effects of drugs and other biological perturbations. Measuring signaling kinetics over multiple timepoints can provide additional insight in areas ranging from research on cellular processes to a patient’s responses to therapy.
How To Measure Cell Signaling?
Intracellular signaling occurs through post-translational protein modifications, predominantly phosphorylation. An estimated 240,000 sites are phosphorylated across all human proteins. When a protein is phosphorylated, its conformation or binding profile changes, which in turn confers different behavior, like increased enzymatic activity or trafficking to the nucleus. Since phosphorylation is reversible, it acts as an on/off switch for most cellular processes. With the advent of phospho-specific antibodies, these activation switches can now be quantified by flow cytometry and other methods.
Beyond phosphorylation, other mechanisms regulate signaling, and some of these can also be measured by flow cytometry. During apoptosis, PARP is cleaved, and the resulting fragment can be quantified with an antibody specific to the cleaved form. IκBα is an inhibitor of the NF-κB transcription factor that is rapidly degraded upon activation of numerous pathways. Intracellular levels of calcium, a secondary messenger, can be detected with specialized fluorescent dyes. And in some cases, the total amount of a particular protein is used as a downstream indicator of pathway activation; for example, total Ki67 reflects transcriptional activation that only occurs when cells are actively cycling.
Flow cytometry is uniquely valuable for assaying cell signaling states. Lysate-based methods, such as Western blot and ELISA, provide the average signaling state of all cells in a sample. In contrast, the single-cell resolution of cytometry reveals what each individual cell looks like. By combining phenotypic markers with cell signaling readouts, both the cell type and functional state of each cell can be measured. Single-cell resolution is especially important with samples that are heterogenous, such as blood, which is made up of dozens of different immune cell types.
Designing a Successful Signaling Flow Experiment
Signaling proteins pose some additional challenges compared to other targets, but these can be addressed with careful assay design and optimization.
Stimulating and Capturing a Signal
While certain mutations or diseases cause persistent protein phosphorylation, most proteins are phosphorylated for only a brief time before returning to their unphosphorylated basal state. A successful phospho flow experiment, therefore, usually requires proper cell stimulation to induce the signaling events of interest. Since many stimuli are detected through receptors expressed only by certain cell subsets, the selection of a stimulus must account for the cell types of interest as well. Even when working with disease samples that have interesting constitutive signaling profiles, stimulation can reveal additional dysregulated responses.
A multitude of stimuli exist: cytokines, chemokines, TLR agonists, antibodies that crosslink cell surface receptors, and pharmacological agonists are common. Which ones to use depends on their relevance to the treatment or disease you’re studying, and the readouts you’re measuring. Importantly, cell lines and primary cells often signal differently, and literature reports or pathway diagrams, based mainly on cell line data, may not hold true in your samples of interest. As mentioned above, stimuli are often selective for certain cell types, and often the best way to determine the effect of a particular stimulus is to empirically test it in a relevant sample type. Even so, cell lines from literature can be useful as controls to ensure both the stimulus and detection reagents are working correctly.
After selecting a stimulus, the two most important experimental variables are stimulation time and concentration. Different signaling pathways and cell types exhibit different signaling dynamics for activation and subsequent downregulation driven by negative feedback. Quicker pathways may be detectable within seconds, while slower pathways take hours to peak. Most commonly, phospho proteins peak in the 5-30 minute range. The concentration of stimulus generally affects the kinetics, with higher doses leading to quicker responses. While incubation temperature also affects signaling kinetics, 37°C is generally chosen for physiological relevance.
Fixation and Permeabilization
Most signaling takes place intracellularly, meaning that cells need to be fixed and permeabilized to allow detection antibodies to reach their targets. Paraformaldehyde is the most common fixative for intracellular flow cytometry and in some cases its concentration may be optimized to improve detection. Permeabilization is performed using detergents (like saponin) or alcohols (like methanol), chosen through empirical testing for the target of interest. Alcohol permeabilization may be required for certain nuclear targets, such as STAT proteins, but denatures proteins and can dramatically affect the detection of most other markers in a panel.
Epitopes on cell surface markers may be impacted by fixation, which covalently crosslinks amine residues, so staining panels developed on live cells need to be re-tested for optimal performance. In some cases, new clones should be evaluated. Since permeabilization gives antibodies access to a multitude of intracellular epitopes, high nonspecific binding is common with permeabilized cells and antibody titers usually need to be reduced. While reducing background fluorescence is helpful for all cytometry experiments, it’s especially important with phospho flow because signaling molecules are often found in low abundance.
In some cases, the strategies above may not do enough to rescue surface staining after fixation and permeabilization, and two-step staining should be evaluated. Staining surface markers after fixation but before permeabilization can improve resolution. In rare cases, live cell surface staining may be performed before or during stimulation but is usually avoided to ensure signaling events are not impacted by staining.
Sample Collection and Storage
Some signaling assays measure phosphorylation that is induced in vivo, for example pharmacodynamic assays for clinical trials or animal studies testing engineered cytokine drugs. In such cases, the drug is the stimulus, and samples should be fixed as soon after collection as possible to preserve signaling. This can be achieved by collecting blood directly in a stabilization tube, like Cyto-Chex, or by adding fixative to the blood soon after collection. Red blood cells are frequently lysed during or directly after fixation. During assay development, time to fixation should be tested to determine sample stability.
For assays requiring ex vivo stimulation, the stimulation needs to be done before fixation. If using a testing laboratory like CellCarta, this means shipping prior to stimulating, and performing an evaluation of stability over a range of possible shipment times and temperatures. Other times, samples will be processed to PBMCs for cryopreservation, in which cases the assay should be developed using the cryopreserved PBMC matrix. Sometimes the cryopreservation time will be tested as part of the sample stability evaluation.
Many times, cell fixation is compatible with storage at –80 °C, which allows samples from different timepoints or subjects to be banked for batch analysis. Cryopreserved PBMCs also offer this opportunity. In most cases, sample batching decreases variability and overall sample processing time.
Analyzing Phospho-Flow Data
On to the fun part: seeing the results of your phosphor flow experiment! If you’re using CellEngine, there are several features that will help you get the most out of your experiments.
Add Metadata
CellEngine uses metadata to drive analysis. During procedure optimization, you can add information about the experimental conditions discussed above to find the ideal protocol conditions. Once the protocol is optimized and you’re analyzing your study samples, you can add experimental variables, such as timepoint, stimulation, and donor outcome. This allows for rapid exploration of data along one or many variables simultaneously, giving more insight into the underlying biology and enabling easy side-by-side comparison of study variables.
Separate Populations in Heterogeneous Samples
If you included phenotyping markers to separate cell types, e.g. from a blood sample, you can use either traditional hierarchical gating or unbiased clustering to perform the first part of your analysis. CellEngine has a number of tools to make it faster to gate, including automatic gate tailoring, which adjusts gates to shifts between samples. For clustering, CellEngine offers FlowSOM, Leiden, Louvain, and ensemble clustering of graphs (ECG). CellEngine’s implementations can process tens to hundreds of millions of events in minutes, so either approach is appropriate for rapid analysis. Clustering is typically paired with dimensionality reduction; see below for more information.
Define a Positive Population, or Compare Signal Intensity
Most assays show a strong enough phospho protein shift that a distinct “positive” population can be defined. In those cases, you can look at percent positivity, such as the percent of cells that are pSTAT5 positive. CellEngine’s percentile tailoring tool can be used to precisely set gate boundaries based on a control sample; for example, at the 98th percentile of the unstimulated control. If you have multiple signaling markers with identifiable positive populations, Boolean and combination populations can be created to understand combinatorial states.
In other cases, the signal intensity (e.g. median fluorescent intensity, MdFI) is used as the readout. A common approach for analyzing intensity is to normalize to a control sample, such as unstimulated cells, and visualize fold-change values.
Explore Visualization Options
Both traditional flow plots and summary statistics charts are valuable approaches to visualize signaling results.
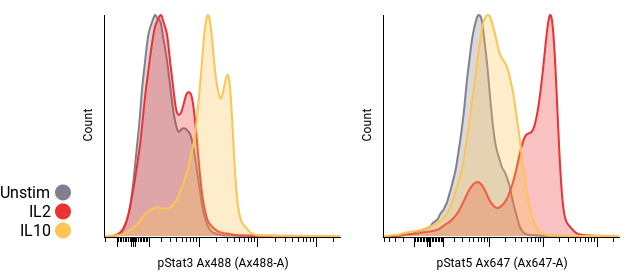
Dot plots and histograms are often used to compare samples. Pivot tables can be used to automatically generate grids of plots, and can be overlaid, as in Fig. 1. These grids are created by choosing pivot dimensions; for example, plotting the treatment condition in one dimension against timepoint in another. Using metadata to lay out plots instead of inserting each plot manually allows for fast, error-free visualization.
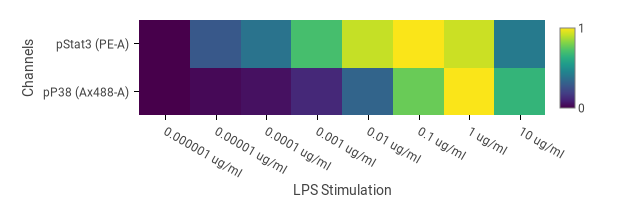
Statistics charts, including bar charts, box plots, line graphs, dose response curves, and heatmaps can show values from two or more FCS files, populations, and/or channels. The heatmap in Fig. 2 was set up by selecting doses for the columns. Some of the doses had replicates, which CellEngine automatically averages. Bar charts and line graphs include error bars showing the standard error of the mean or standard deviation across replicates. Statistics charts can be normalized to a baseline, allowing for figures like Fig. 3 and Fig. 4, which show fold-change of phosphorylation relative to an unstimulated control. Heatmaps can also normalize each channel independently, so you can combine bright and dim readouts together on the same heatmap. Line charts are useful for summarizing large amounts of information using overlaid variables.
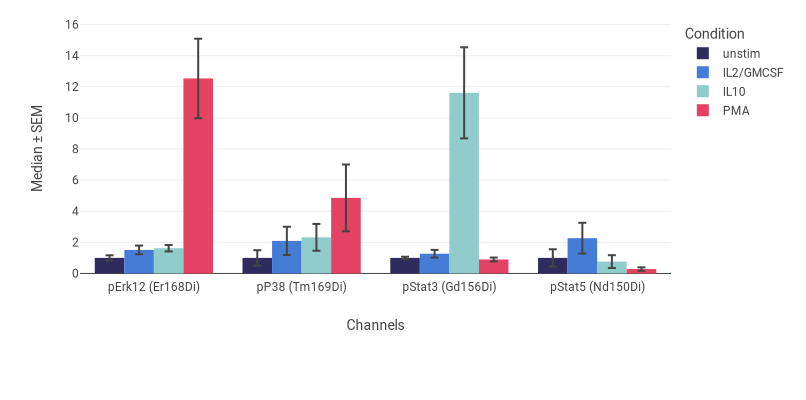
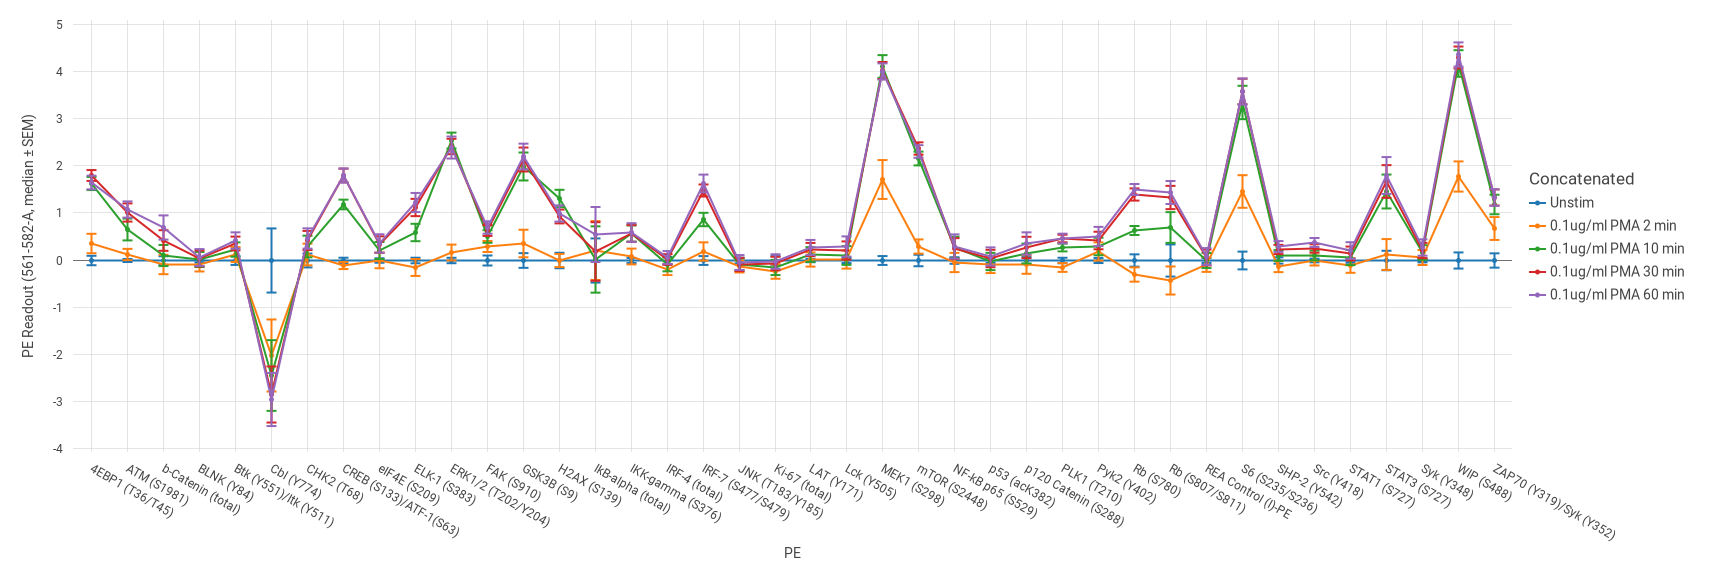
Figure 4. Induction profile of 40 phospho proteins in gated CD4 T cells after PMA stimulation for various time points visualized on a log2 fold change scale (relative to unstimulated, blue). Error bars show the variation observed across 3 healthy human donors. The readout channels, method of normalization, and experimental variables can be easily updated with the click of a button.
Unsupervised analysis
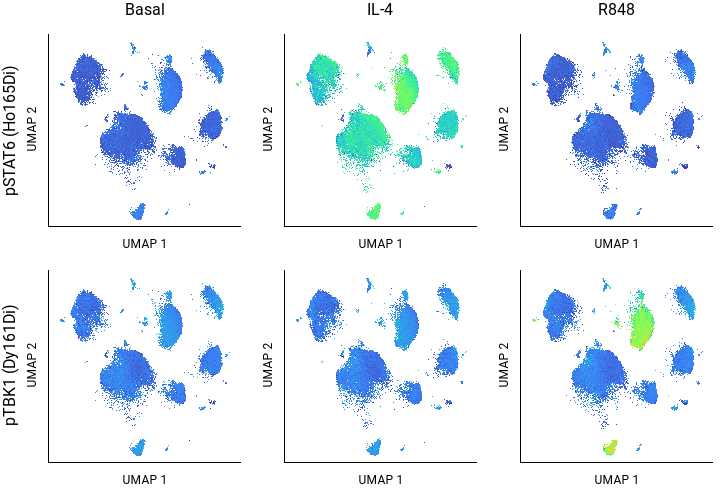
In experiments where a gating hierarchy is difficult to establish – for example, when studying novel biology, using new markers, or looking at abnormal or diseased cells – dimensionality reduction can be used to group similar cells by any combination of features on a 2D plot. The method creates new PCA, UMAP, or t-SNE parameters that capture combined variance from a set of underlying features that separates cell types showing different staining profiles. By using a pivot table to arrange the experimental variables, and a color scale to indicate the intensity of signaling measurements, you can quickly survey which clusters respond to which stimuli (Fig. 5).
While clustering is commonly used to identify different phenotypic populations, it can also reveal different cell states when signaling features are included as clustering variables; for example, resting vs activated vs exhausted T cells may form separate clusters that can be annotated by examining the signaling profiles of each cluster.
Conclusions
Measuring cell signaling by flow cytometry is more complex than cell phenotyping alone but the functional information obtained provides unique insights into cellular behavior across the different populations of a biological sample. A key application of phospho flow, among others, is the characterization of patient responses to drug in a clinical biomarker setting. While gene expression can be used as a downstream measure of pathway activation or inhibition, phospho flow compliments it by measuring proteins that are directly proximal to the drug target.
CellEngine provides all of the tools needed for fast and easy analysis of phospho flow data. Try it out today! Don’t want to run phospho flow yourself? CellCarta also offers GxP-level, end-to-end flow cytometry services.
Read More
- Krutzik P., Nolan G. Intracellular phospho-protein staining techniques for flow cytometry: monitoring single cell signaling events. 2003.
- Krutzik P., Irish J., Nolan G., et. al. Analysis of protein phosphorylation and cellular signaling events by flow cytometry: techniques and clinical applications. 2004.
- Irish J., Rovaland R., Krutzik P., et. al. Single Cell Profiling of Potentiated Phospho-Protein Networks in Cancer Cells. 2004.
- Clutter M., Krutzik P., Nolan G. Phospho-specific flow cytometry in drug discovery. 2005.
- Schulz K., Danna E., Krutzik P., et. al. Single-Cell Phospho-Protein Analysis by Flow Cytometry. 2012.
- Pang K., Wang W., Qin J., et. al. Role of protein phosphorylation in cell signaling, disease, and the intervention therapy. 2022.
- Fluorofinder's Tips to Minimize Autofluorescence.