New Feature Highlight: Gating Hierarchy Tool
Creating a figure to communicate a gating hierarchy is a common task for data review and for sharing gating strategies with other scientists. These consist of a series of flow plots showing the gate positions and parent-child relationships between gated populations. CellEngine can now generate these plots automatically, making analysis even faster.
Why a Gating Hierarchy Feature?
CellEngine was designed to make analysis quick and easy. Its existing pivot table feature can be used to create grids of flow plots arranged by metadata, or NxN plots showing all combinations of X and Y channels. However, gating hierarchies had to be made manually using individual flow plots and arrows. Because of their size and complexity, they can be time-consuming to create, especially since a high-dimensional spectral or CyTOF dataset could potentially contain dozens of levels and hundreds of gates. It can be easy to miss a gate in large hierarchies, requiring careful review of the layout after creation.
To address this issue, we added a flexible tool to automate the creation of gating hierarchies. It includes several layout options suitable for showing either a single population with its parent gates, or many populations in a branching layout. Importantly, the result is still a set of flow plots and arrows, allowing easy customization and refinement to integrate into any illustration.
Show Parent Gates for a Single Population
Gating hierarchies can serve several purposes, so there are multiple layout options available for automatic figure creation. In some circumstances, you may want to see all ancestor gates for a specific population.
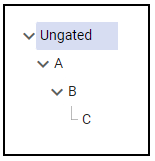
If the above was the gating hierarchy, you could select C, and plots showing the gates for A, B, and C would be automatically generated:
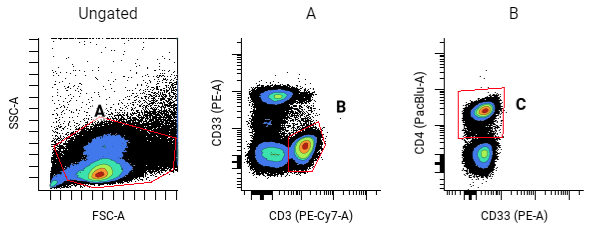
These can generated vertically or horizontally.
Creating Branching Gating Hierarchies
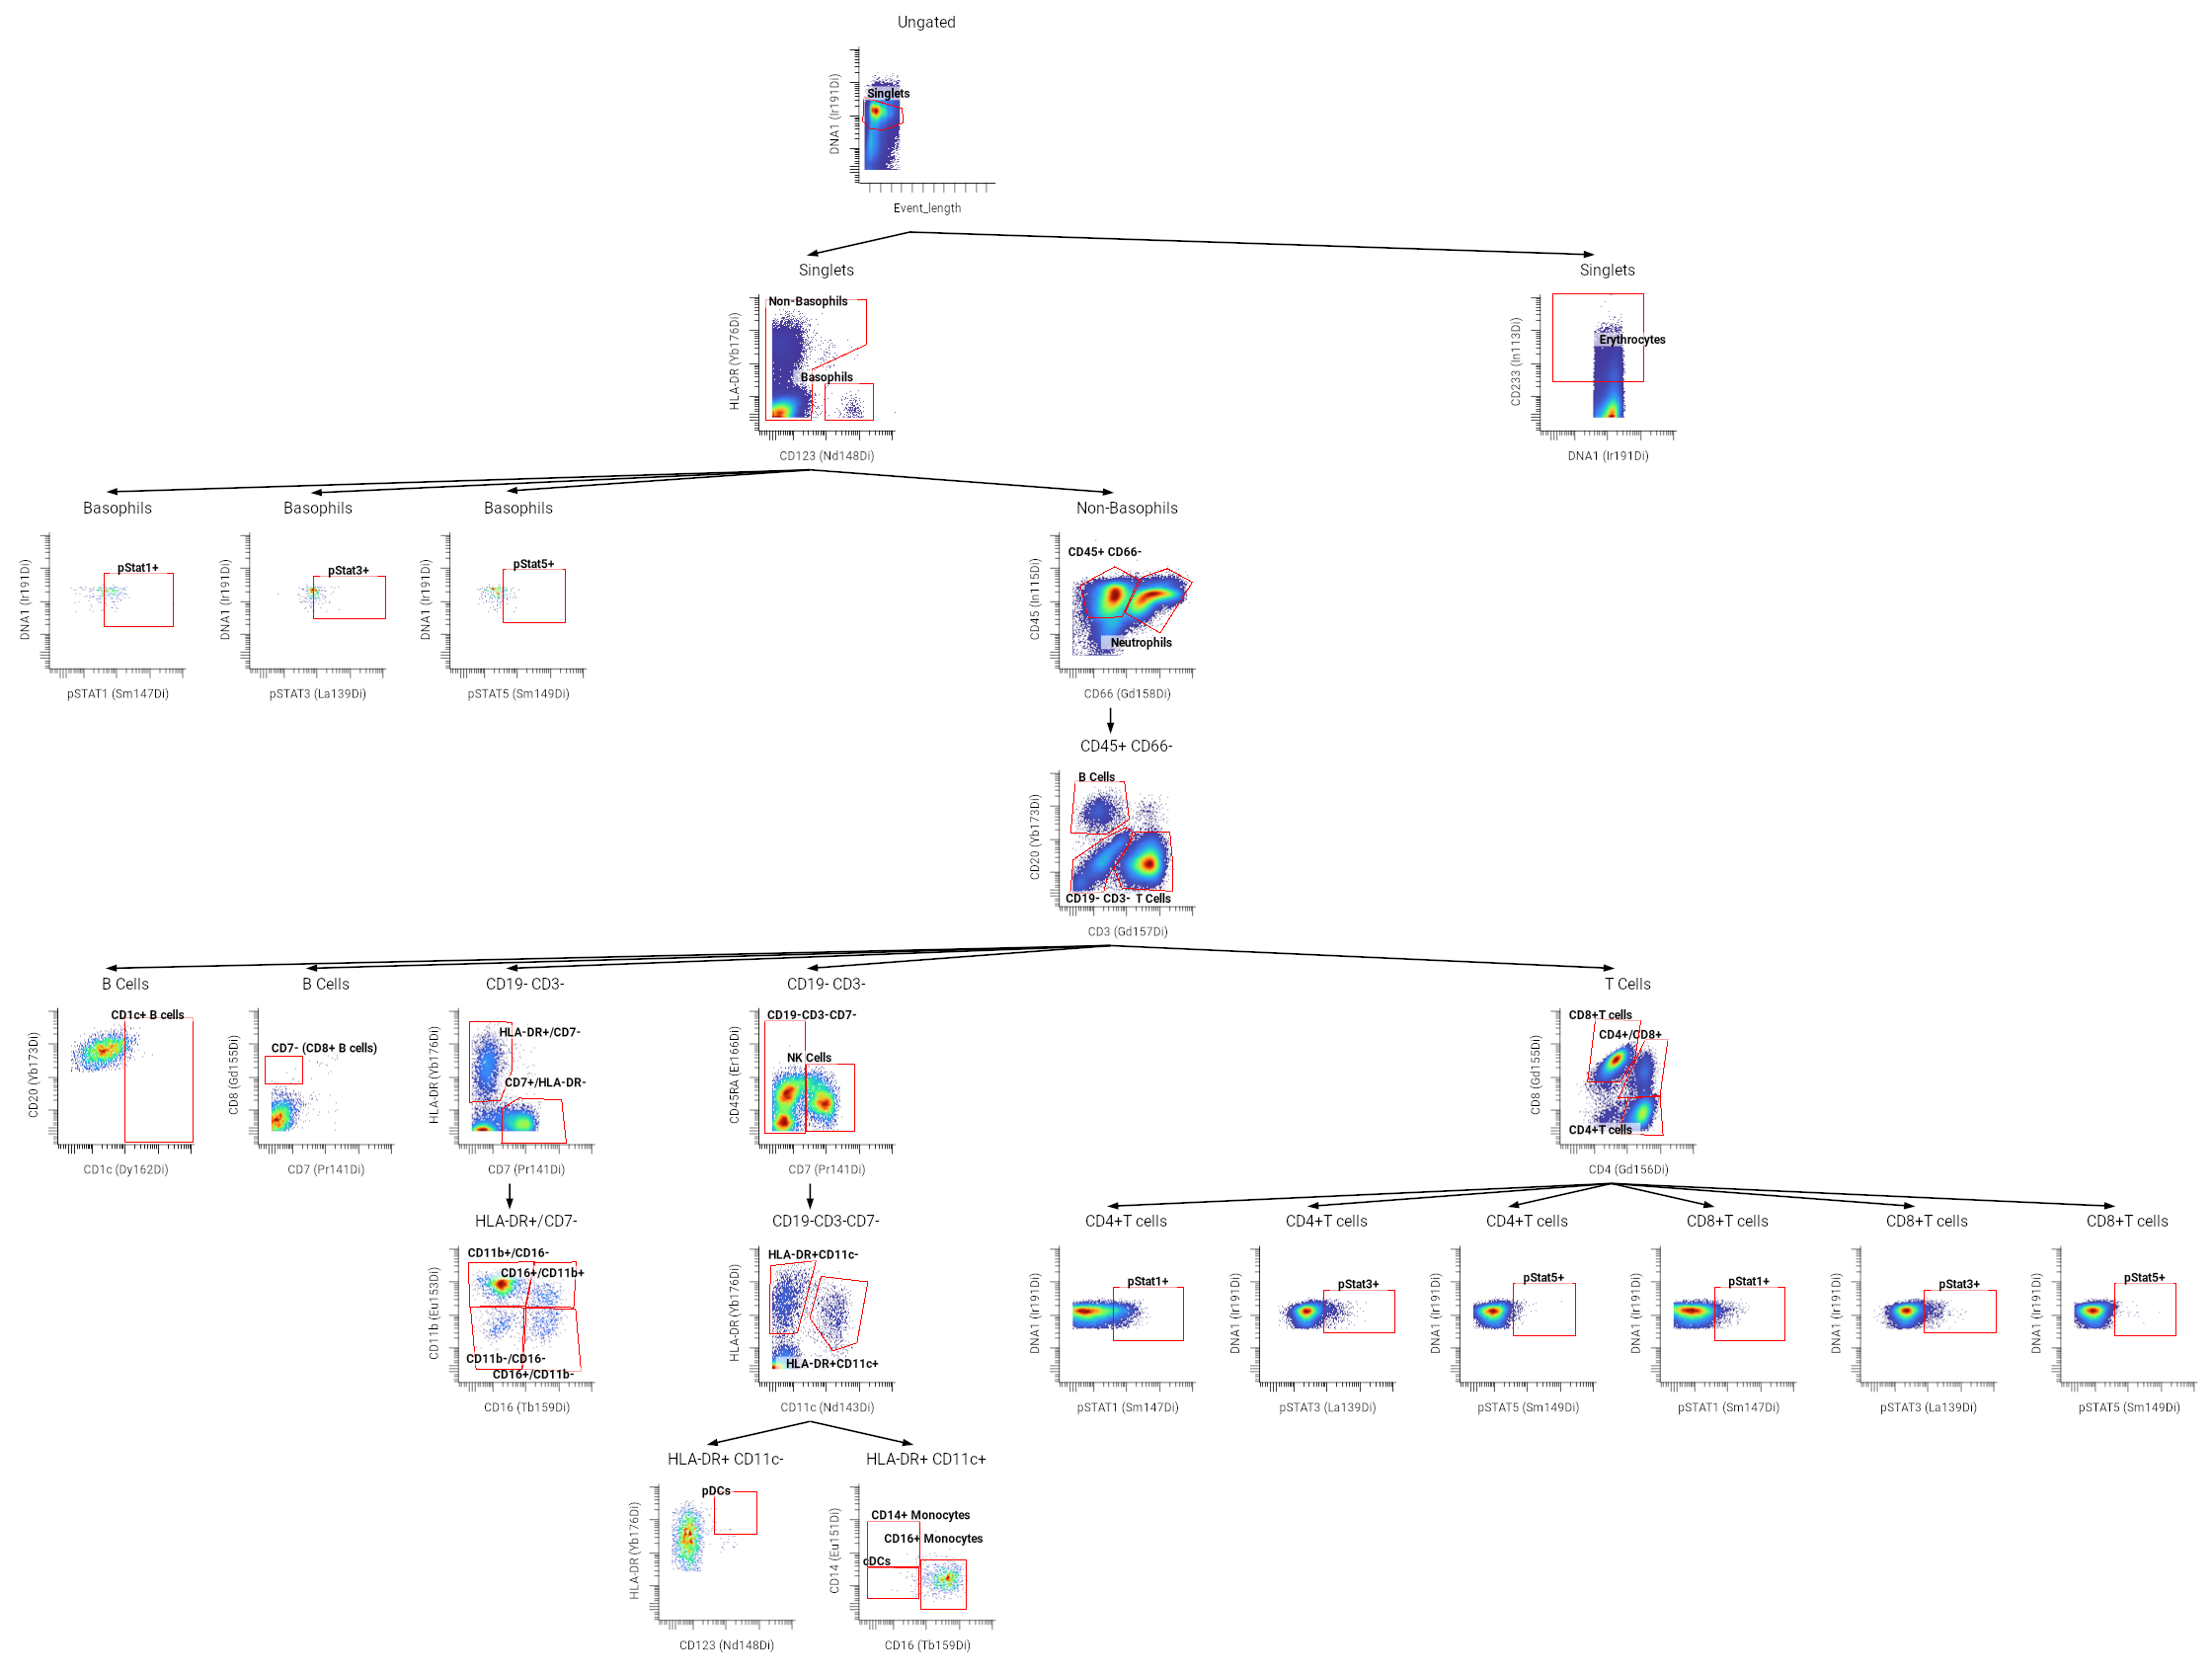
More complex, branching hierarchies can also be created to show several selected gates, or even an entire hierarchy. Arrows are automatically placed to connect gates to their children, making it easier to see the gating structure all at once.
Choose between left-aligned and layered graph layouts. Left-aligned graphs start with the first plot in each level on the left side, with additional plots added to the right. Layered graphs are centered instead, adding plots to the left and right sides on each level.
Using the New Gating Hierarchy Tool
This feature eliminates the manual work of creating and arranging flow plots and arrows. The components of an automatically generated hierarchy are just like the ones that can be manually created, so their exact positions, sizes and display options (such as smoothing and coloring) can be adjusted as desired. Batching can be used to create separate pages for individual FCS files.
Gating hierarchies are just the newest in the features to make analysis faster and easier. Try CellEngine out with a free two-month trial at https://cellengine.com.