Scaling flow cytometry data: why and how
Correctly scaling flow cytometry data is critical to effective interpretation and the proper quantitative handling of data.
Why scale data?
Flow plots are customarily shown with logarithmic-like scale transformations such as arcsinh, logicle, biexponential, hyperlog and Vlog. These improve upon logarithmic scaling by allowing the display of negative values and avoiding visual artifacts at the low end of the display range. But why do we use logarithmic scaling? There are three key reasons:
-
To show the large dynamic range. Modern flow cytometers have five or more decades of linear range, which is impossible to visualize without a log-like scale.
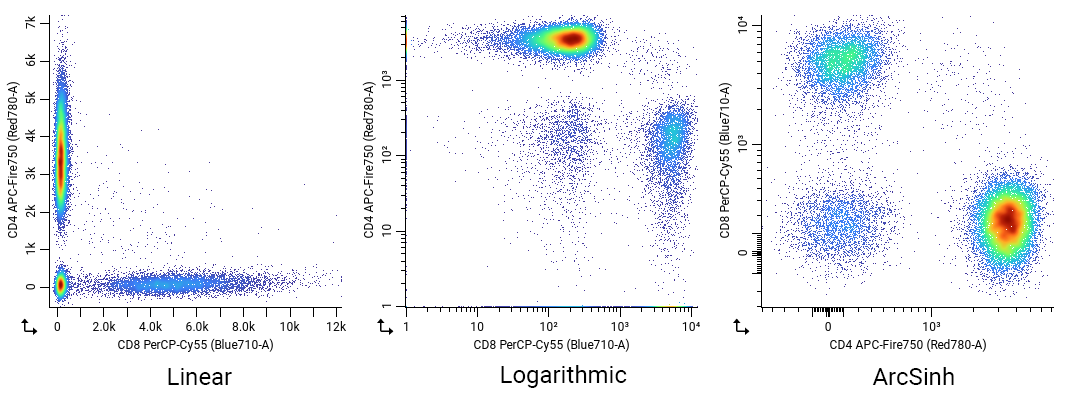
Here we’re showing the same dataset is shown with linear (left), logarithmic (middle) or arcsinh (right) scaling. The linear plot doesn’t show the full dynamic range of the data well: Aside from being visually unappealing, it would also be difficult to gate low/mid/high populations with this view. The logarithmic plot improves the dynamic range, but has a large amount of data “piled up” on the axes that should be part of the CD4+, CD8+ and CD4-/CD8- populations. In the worst case, these could be misinterpreted as entirely separate populations! Finally, the arcsinh plot works perfectly: the populations are clearly visible across the entire dynamic range and there’s no pile-up on the axes.
-
To perceptually normalize small differences at the low end of the scale. For example, an MFI of 2 vs. 1 is a two-fold change, but a tiny difference when scaled.
-
To make the variances of populations more uniform over the signal range, correcting for the natural correlation of variation with signal intensity. This is a very math-y reason that most cytometrists are unaware of, but it ends up being important in the proper, quantitative handling of flow cytometry data.
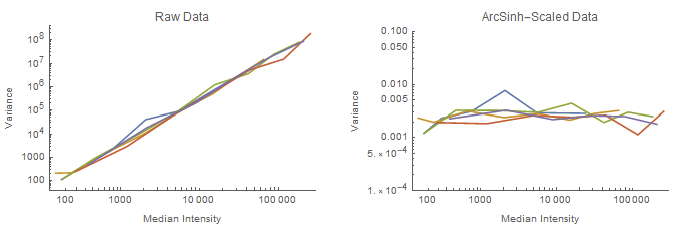
Here we’re showing the median fluorescence intensity (MdFI) of calibration beads acquired over a range of photomultiplier tube (PMT) voltages. Each line represents one bead peak’s MdFIs tracked across the range of voltages. Notice in the left plot, which is the raw median intensity, that the variance correlates with the median intensity–specifically via a power law relationship. This is an intrinsic property of many physical measurements.
When we apply an arcsinh transformation (right), the variance becomes uniform over the dynamic range.
How do I correctly set scales?
CellEngine sets instrument-specific default scale values when uploading FCS files. However, proper scaling depends on the reagents and instrument acquisition settings for each dataset. Our general recommendation for fluorescence and mass cytometry parameters is as follows:
-
Type: Use arcsinh for fluorescence and mass cytometry parameters. CellEngine does not provide a “biexponential” scale type; arcsinh is effective, simple, and consistent with what the genomics field uses. Biexponential scales are unintuitive, have no closed-form solution, and were invented specifically for flow cytometry.
-
Maximum: Leave the maximum unchanged, or reduce it to “zoom in” on the data. Increasing the maximum is almost never effective, as the maximum recorded value is determined by the cytometer hardware.
-
Minimum: Adjust the minimum to bring all or most of the data within the range of the plot.
-
Arcsinh Cofactor: Arcsinh scales have a “cofactor,” which is simply a value by which the number is divided before applying arcsinh. Increasing this value compresses the data around zero. As a starting point, set the arcsinh cofactor to half the magnitude of the minimum. For example, if the minimum is set to −2000, set the cofactor to 1000. If using a cytometer that uses avalanche photodiode detectors, such as the Beckman-Coulter CytoFLEX or Cytek Aurora, you may need to increase the cofactor significantly to pull together data that appears spread across 0.
Especially for large panels, this can be a tedious process. Luckily, CellEngine provides an easy tool to automatically set arcsinh scale parameters. Simply open the scale editor, select the channels to scale and click the “autoscale” button. This tool estimates the width of the negative population in order to determine the cofactor and minimum.
Should I use scaled or raw values in downstream analysis?
If you are showing a bar chart of MFIs, for example, then we and others1 recommend showing the raw statistics with a log or log-like Y axis, as is customary for 1D and 2D flow plots. The ticks should be labeled with the unscaled values (e.g. 104 and not 4). When reading and discussing the chart, this makes it easy to communicate messages like "we observed a three log-decade difference." Similarly, in dose-response analysis, it is sometimes convenient to discuss the log-IC50 (or "pIC50," so-named after the logarithmic pH scale).
If you are performing statistical tests, then it depends furthermore on the test. Keep in mind, many of the components of flow cytometry assays are inherently linear (or technically sigmoidal with a large linear range):
-
Instrument detectors (e.g. photomultiplier tubes (PMTs), avalanche photodiodes (APDs), CyTOF detector) and digital signal processing electronics have linear sensitivity, so their signals don’t need log-like transformation to linearize it.
Early cytometers used log amplifiers that reported log-scaled data back to the computer, and historically converting from log back to linear was inaccurate and slow. In old literature, it’s common to see statistics calculated on this log-transformed data for this reason. The use of geometric mean is actually a holdover from this era!
-
The fluorescence and the number of dye molecules, or the CyTOF signal and the number of metal atoms, correlate linearly, and thus so do the signal and the number of antigens, receptors, DNA content, etc.
However, many quantities in biology (including expression of many proteins) have logarithmic distributions. Parametric statistical tests make assumptions about the underlying distribution that must be correct for the test to be correct. For example, Student’s t-test assumes the two populations follow normal distributions and have equal variance, Welch’s t-test assumes normal distribution, and ANOVA assumes equal variance and normally distributed residuals. As shown above and in 2 and 3, the log-like scaling methods are effective for stabilizing the variance and achieving normal distributions over the full dynamic range of cytometry data, and could thus be used before applying a test that requires normal distribution. Alternatively, a different statistical test that more naturally applies to the data could be used. For example the Kolmogorov-Smirnov and Anderson-Darling distribution tests are non-parametric, meaning that $KolmogorovSmirnovTest[data1, data2]$ is equal to $KolmogorovSmirnovTest[ArcSinh[data1], ArcSinh[data2]]$.
Finally, if you are running a clustering or dimensionality-reduction algorithm such as t-SNE, these algorithms typically do a better job resolving populations if they “see” the data with the same scales that you would see when gating–that is, if there is no mean-variance relationship trend. CellEngine’s built-in algorithms apply scales.
A word of caution
When using transformations, use them judiciously and responsibly. Transforming data gives you an opportunity to manipulate statistics by adjusting the arcsinh cofactor or biexponential parameters. For example, you could tweak your reported statistics until the P value is significant or until multiple populations collapse into one. Using computational methods to set scale parameters, such as CellEngine's built-in tool or the method in 3, can avoid manual bias.
-
Roederer M, Darzynkiewicz Z, Parks DR. Guidelines for the presentation of flow cytometric data. Methods Cell Biol. 2004;75:241-56. doi: 10.1016/s0091-679x(04)75010-4. ↩
-
Erez A, Vogel R, Mugler A, Belmonte A, Altan-Bonnet G. Modeling of cytometry data in logarithmic space: When is a bimodal distribution not bimodal? Cytometry A. 2018 Jun;93(6):611-619. doi: 10.1002/cyto.a.23333. ↩
-
Azad A, Rajwa B, Pothen A. flowVS: channel-specific variance stabilization in flow cytometry. BMC Bioinformatics. 2016 Jul 28;17:291. doi: 10.1186/s12859-016-1083-9. ↩↩